Find Another Gear
Led by a senior team of experts with a track record of success, our marketing and lead generation services are designed to fuel growth.
- Differentiate yourself from the competition in a crowded market.
- Tell a compelling and cohesive story across every touch point.
- Engage prospects across the buyer journey to create a predictable pipeline.
- Drive more of the right visitors to your website.
- Create a website experience that converts visitors into leads.
- Generate more high-quality, high-intent sales opportunities.

We Think Different
Eliminate Hit-or-Miss Marketing

Expert-Led Services Tailored To Your Needs
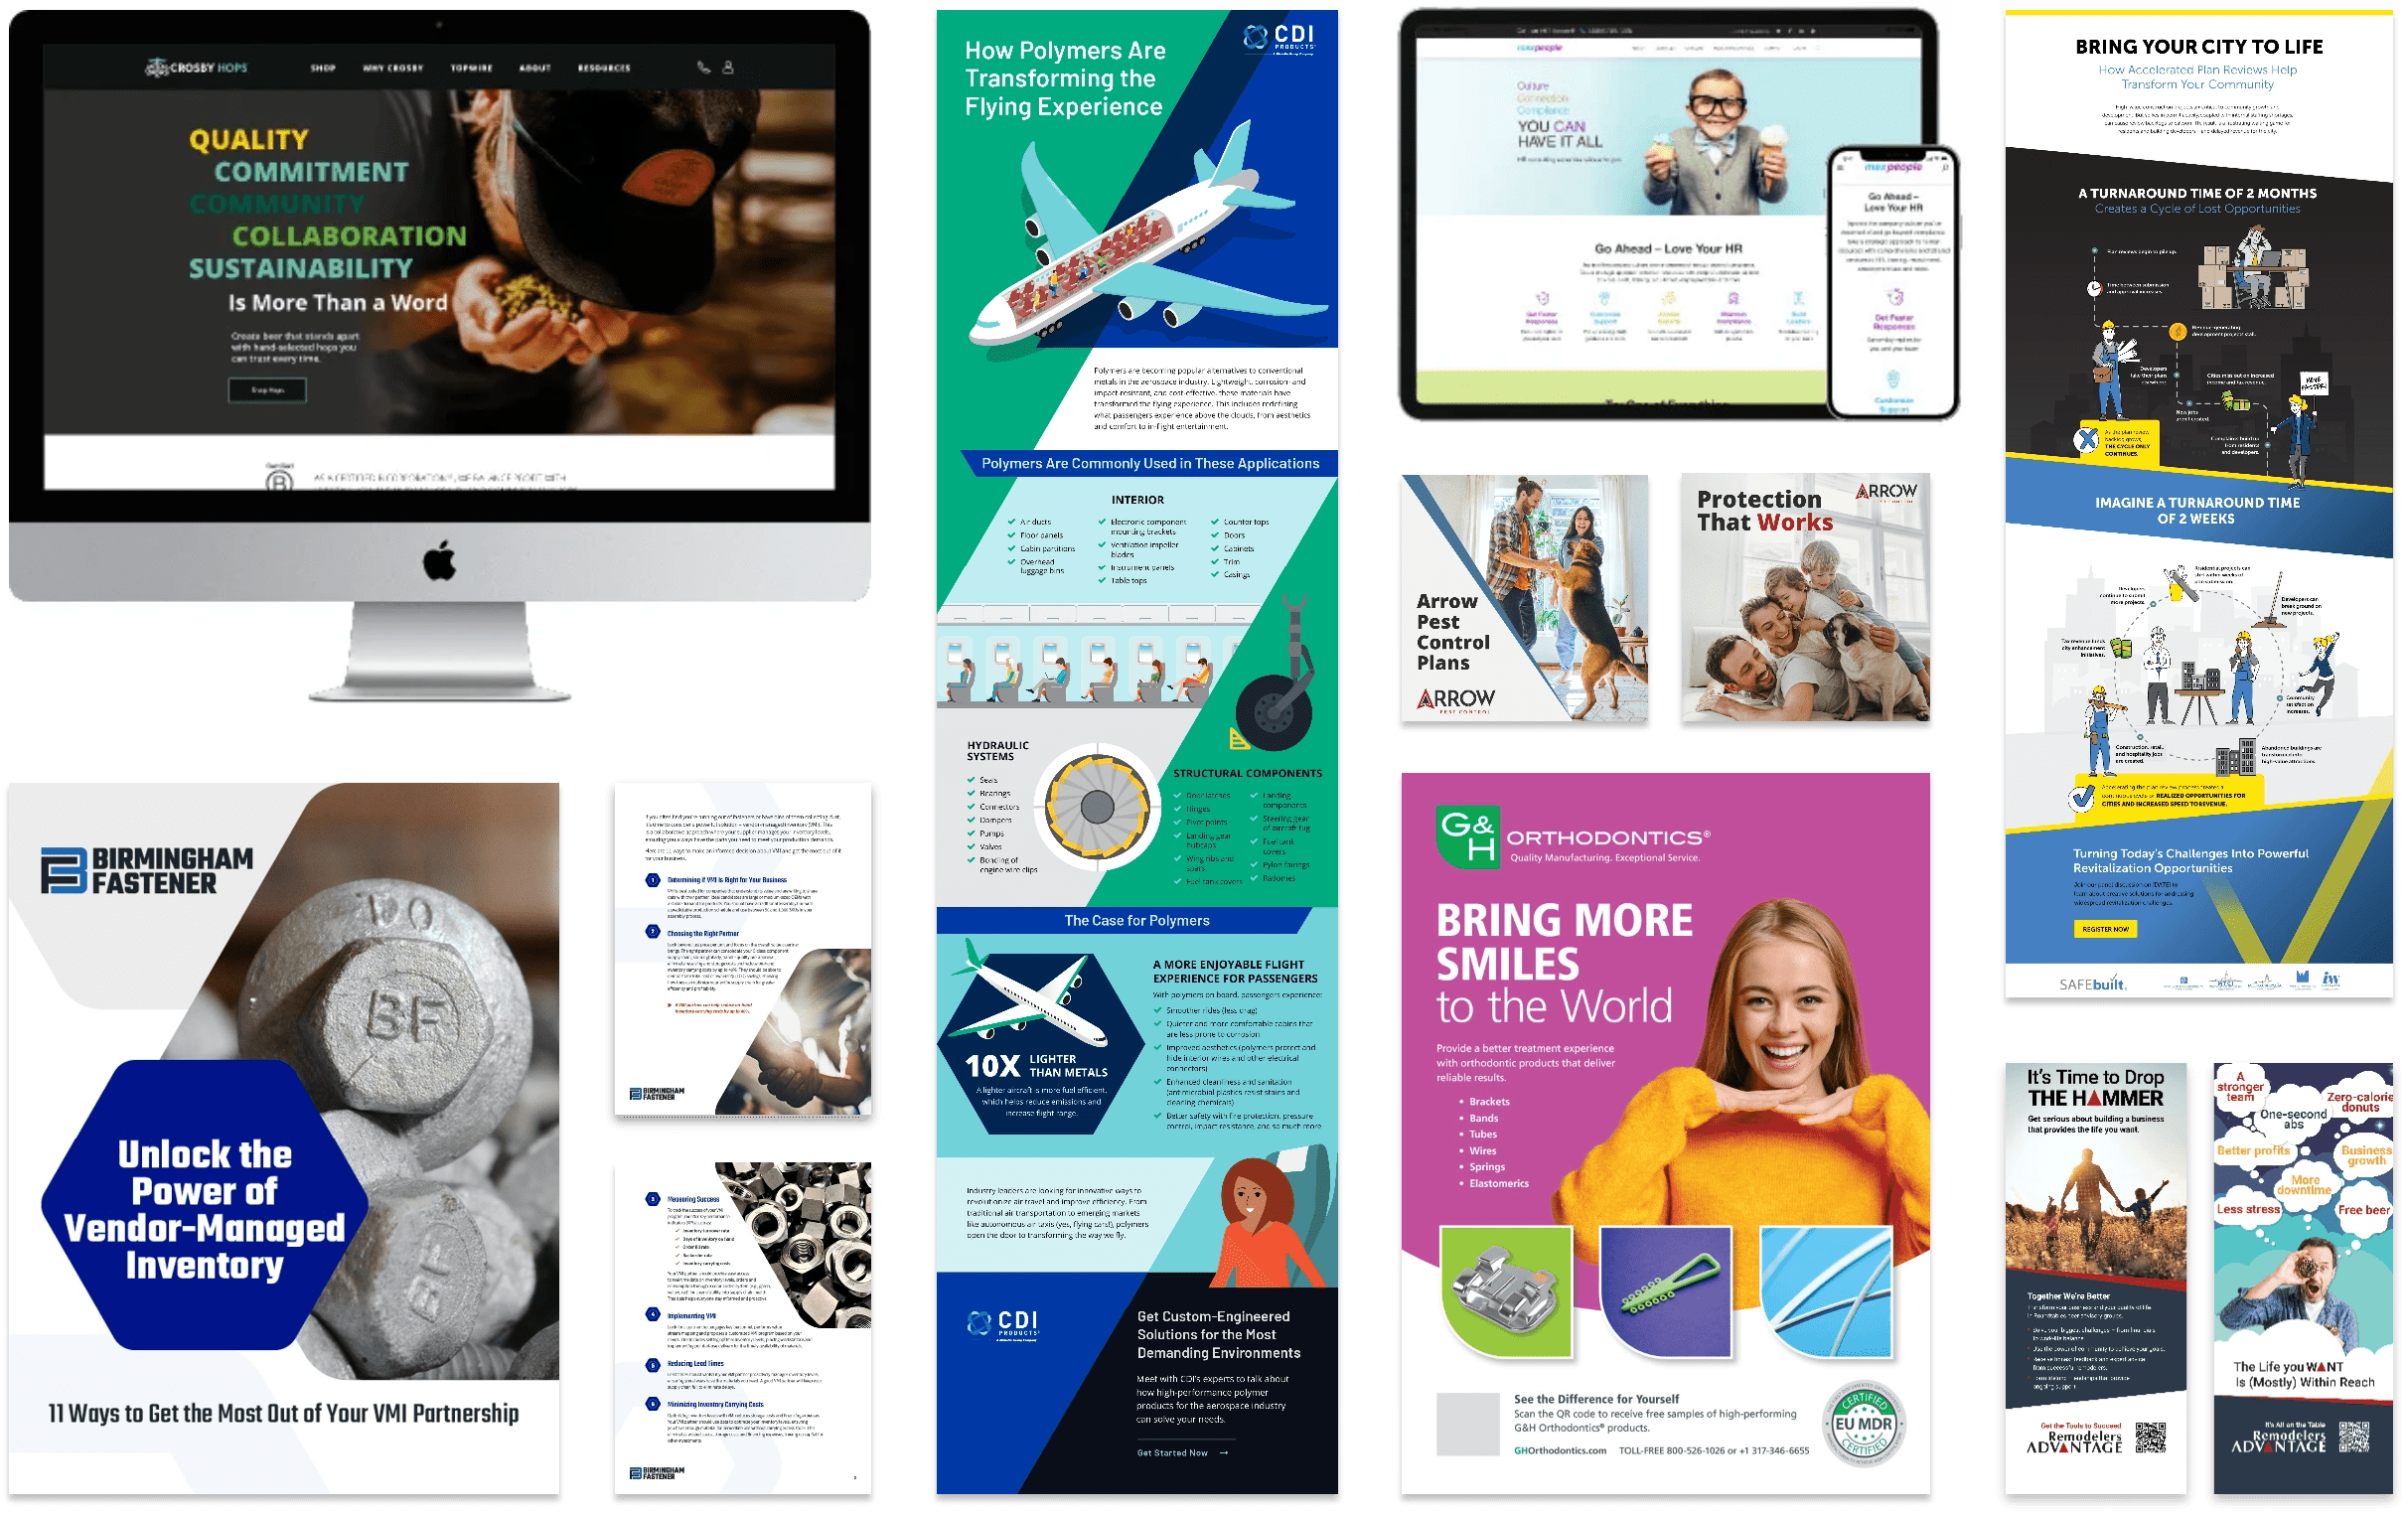
Creation
Remarkable or Nothing

“From custom web development to strategizing on key workflows to implementing inbound leads, they have a wealth of knowledge and experience that leads to a very versatile service provider for HubSpot use cases. They helped train our staff on how to use the full feature set, down to very specific questions on our custom HubSpot CRM setup and database workflows.”
Karl Fauerbach, Digital Marketing Specialist, Intelligent Video Solutions

“They listen to your needs and ensure that they are met and that we are satisfied with the results. Everything from content creation to executing projects has benefited our start-up business. They always bring different ideas and knowledge to the table, which helps us think outside of the box!”
Daniela Martos, Customer Success Manager, PTO Exchange

“We needed a lot of help getting our campaigns out the door, and then we needed a team to ensure that they produced the desired results. We were WOWed by what their team did for us and how it worked.”
Zak Schroerlucke, Marketing Manager, Crosby Hops
Performance Certified