


Key Performance Metrics Are Critical For Sales Enablement Improvements
-1.jpg?width=300&name=ThinkstockPhotos-807539914%20(1)-1.jpg) Most people today have realized that marketing is a science, but a lot fewer people know that sales is equally scientific. While it has a different set of metrics, we track and optimize a wide variety of sales execution metrics for clients. One of the best metrics (and least understood) is pipeline velocity.
Most people today have realized that marketing is a science, but a lot fewer people know that sales is equally scientific. While it has a different set of metrics, we track and optimize a wide variety of sales execution metrics for clients. One of the best metrics (and least understood) is pipeline velocity.
Pipeline velocity is defined as the speed by which leads move through your pipeline, whether won or lost. What’s interesting about the pipeline velocity metric is that you should care more about the changes in the number over time than you should about the actual number. In other words, pipeline velocity data is only relevant when compared to the velocity over time.
Here’s how you calculate pipeline velocity and how it powers revenue growth.
Pipeline Velocity – The Formula
 Tracking pipeline velocity is a lot like tracking regular velocity, which is to say you divide a change in position by the change in time. In the case of pipeline, the equation is: number of sales-qualified leads in your pipeline times the overall win rate percentage of your sales team times the average deal size (in dollars) divided by your current sales cycle in days.
Using this formula, your result will be the estimated amount of revenue you have coming through the pipeline every day. The higher that number, the better your pipeline velocity.
Here’s an example: One of our clients has 43 qualified sales opportunities in the pipeline this month. The win rate on qualified sales opportunities is 30%. The average deal size is $50,000 and the current sales cycle is 65 days. This makes the client’s current pipeline velocity $9,923 for the month. What this tells you is that every day around $9,900 is flowing through the pipeline.
To give you an example of how making small changes in your sales process can improve your pipeline velocity, look at the calculations with some small improvements. If our client can get to 50 sales-qualified leads and increase the close rate to just 33% without increasing average revenue per new client but shortening the sales cycle from 65 days to 60 days, pipeline velocity would improve from $9,923 a day to $13,750 a day. That’s a pretty big increase by moving just a few metrics a modest amount.
Here’s a chart you can use as a reference to do your own calculations.
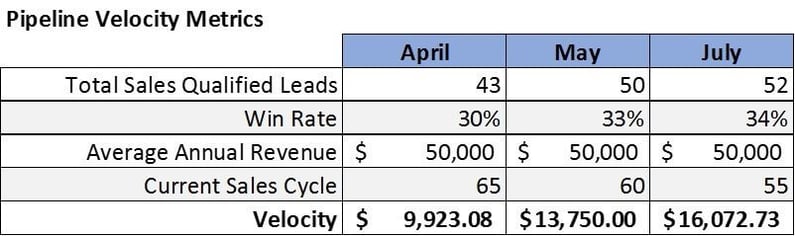
Note that these velocity numbers represent a day rate, and while you don’t need to track velocity daily, the metrics in the formula will change daily (especially the number of sales-qualified leads in the pipeline). Next, we’ll cover how to use velocity in forecasting monthly revenue.
Using Velocity In Forecasting
 Forecasting is one of the hardest tasks associated with sales management and predicting revenue for planning purposes.
Sales management or sales operations typically deploys several forecasting techniques, but none are brilliant by any stretch.
For example, most people use the percentage method of forecasting. Sales reps go through their deals and give a percentage chance of closing estimate. That percentage is then multiplied by the deal value and that revenue is forecasted. If I have a deal with a 50% chance of closing and it’s worth $100,000 over the course of the year, I’d be projecting $50,000 in revenue for this deal for this month.
This system has so many flaws in it that I hate to see clients using it, but they do because it’s easy. The first flaw is that with a 50% close rate it’s likely the deal won’t close this month (maybe it will close next month), so that’s a problem. You’re never getting a percentage of a closed deal. You either get 100% of revenue when you win or 0% of revenue when you lose, so the revenue calculation is inaccurate.
The more deals you use this methodology with, the lower the accuracy of the projections. It makes sense for us to be searching for a more accurate and reliable forecasting methodology. What I like about pipeline velocity is that if you multiply your daily rate by the number of days in the month, and you stay up to date on your velocity data, you should come up with a much better, more accurate forecast.
Let’s look at our example from above. The April data shows a monthly sales forecast of $9,923 (daily pipeline velocity) times 30 days in April, meaning this client will do around $297,000 in April. As the number of leads goes up and down, the close rate changes and the average sales cycle moves. This number is going to fluctuate, but you’ll always have a dynamic forecast for the month. This forecast is also based on live sales data, not sales rep estimates, so the accuracy should be significantly better.
I ran the same data through the estimated close rate forecasting methodology and came up with a $636,000 monthly revenue forecast — over double the pipeline velocity forecasting methodology. This might be one reason why sales teams are constantly over-projecting and under-delivering. It’s also hard to ignore the high amount of qualitative data (the sales reps’ estimated close percentage) and its impact on the inaccuracy of the forecast. The pipeline velocity methodology removes all qualitative data, which is something to consider if you’re doing any forecasting.
What You Can Do To Increase Pipeline Velocity
This is all great, and it’s relatively easy to start tracking pipeline velocity, but the real question should be: “What can we do to increase our velocity?” The good news is you can make improvements in a lot of areas to increase the velocity of your pipeline.
Increasing The Opportunities
The easiest one to identify and tackle is obviously increasing the number of sales-qualified leads or sales opportunities. This is clearly a marketing function. The more leads you generate, the more sales-qualified leads should be produced. It’s possible that you have an issue with a large number of unqualified leads, meaning your marketing is not attracting the kind of people your sales team wants to and needs to talk with, but this is not usually the challenge.
Usually, you don’t have enough leads, sales-qualified leads and sales opportunities. This typically comes from a lack of high-quality content and offers, an inadequate lead nurturing and email marketing effort, a poor website experience that can’t turn visitors into leads, and a lack of reach to get your message out to people who might be interested in your products or services. Moving this number up typically requires an investment in dollars and time to create and then wait for these tactics to work.
Increasing The Close Rates
The next number is the close rate. This requires a deep dive into your existing sales process. Since this represents the entire sales process from initial qualified lead to final closed sale, a lot of other conversion rates along the way should be looked at. It’s possible that you might find one issue with one stage in the sales process, as opposed to a lot of issues all along the way.
You can make small changes that improve conversion rates in a small way but add up to big improvements in your overall conversion rate. Remember, even a 3% increase can have a big impact on revenue.
Some of the improvements you might look at include the documents you use and how you use content during the sales process to get prospects to better understand your solutions. You want to make sure it’s clear in the prospect’s mind why your company is better than the competition. If your sales process is strategically designed to eliminate as much friction as possible, all of the conversion rates along the way should increase.
Increasing Average Revenue Per New Customer
This is probably one of the toughest to increase. Yes, you can raise your prices, but you can’t raise them every month. What you can do is make sure you’re digging deep enough with your prospects to identify all of their challenges and give them comprehensive recommendations. Companies that use “land and expand” strategies often suffer from underselling their new customers, and in a lot of cases, they do a poor job marketing and selling to them later on to execute the expand part of the “land and expand” strategy.
If you make a more concerted effort to get customers into the right products and services out of the gate, you should see your average revenue per new customer numbers going up.
Shortening The Sales Cycle
You have a wonderful opportunity to work hard to shorten your sales cycle. The other side of the coin here is we’re seeing client-side sales cycles increasing primarily due to the sheer amount of content available to prospects and the general confusion most prospects are facing when making purchase decisions.
This looks like an opportunity to me, and we’re working hard with our clients to help them create a sales process that is so remarkable prospects are impressed, educated, advised and guided along their buyer journey. Clients that actively manage those sales processes and actively work to improve their own sales processes typically see dramatic drops in sales cycle length, and this does have an equally dramatic ability to power up the revenue forecasting.
Eliminating meetings, improving communication, better managing advocacy and references, asking more direct questions during the process, setting better expectations, and constantly confirming timelines and priorities helps keep everyone focused and moving forward efficiently. Even cutting three or four days off the back end of the sale process can have a major impact on hitting your revenue goals.
Making changes, especially to sales processes, can be uncomfortable. I hope you see from the examples above that these are small changes that can have a big effect on how you track sales, measure performance, forecast revenue and proactively go after your goals.
Square 2 Marketing – Revenue Is Earned Through Experience, Methodology And Insights!

Eliminate Hit-or-Miss Marketing Moves
Get advice, tips, tools and guidance to generate more leads for your company in this weekly email newsletter.


The Secret to Generating High-Quality Leads for Your Sales Team

The Secret to Generating High-Quality Leads for Your Sales Team